
The goal of the Analytics feature is to encourage organizations to take a deeper look at how people are interacting with their campaigns, fundraisers, sweepstakes and more.
The dashboard translates the data into visuals such as graphs and charts to help them better understand and analyze their strengths, weaknesses, and growth.
About
Process
We were engaged with researching and designing an administrative back end to manage an organization’s Analytics.
Competitive Research - We performed Competitive Analysis on a variety of data table visualizations and other analytics platforms.
Flow - Since the feature lives on one page the information architecture was designed as a hierarchy - thinking about what order the user would prefer to view the data.
Sketch - Once a flow was in place, the next step was to sketch out effective layouts of the design before moving into wireframing.
Wireframe - Desktop mid-fidelity wireframes were built and iterated upon with stakeholders over the course of 2 weeks.
Testing - Usability tests were conducted with 4 people. Feedback was used to reiterate on the wireframes to make the design easier to use.
High-Fi - Wireframes were passed to a UI designer for polishing. This feature is currently in development.
The Team: Ty Callahan, Thu Do, Megan Martin
Partners: Juice Creative Group - Product Management, UI Design, Development
Roles: UX Research and Design, Information Architecture, Usability Testing
Time: 4 weeks
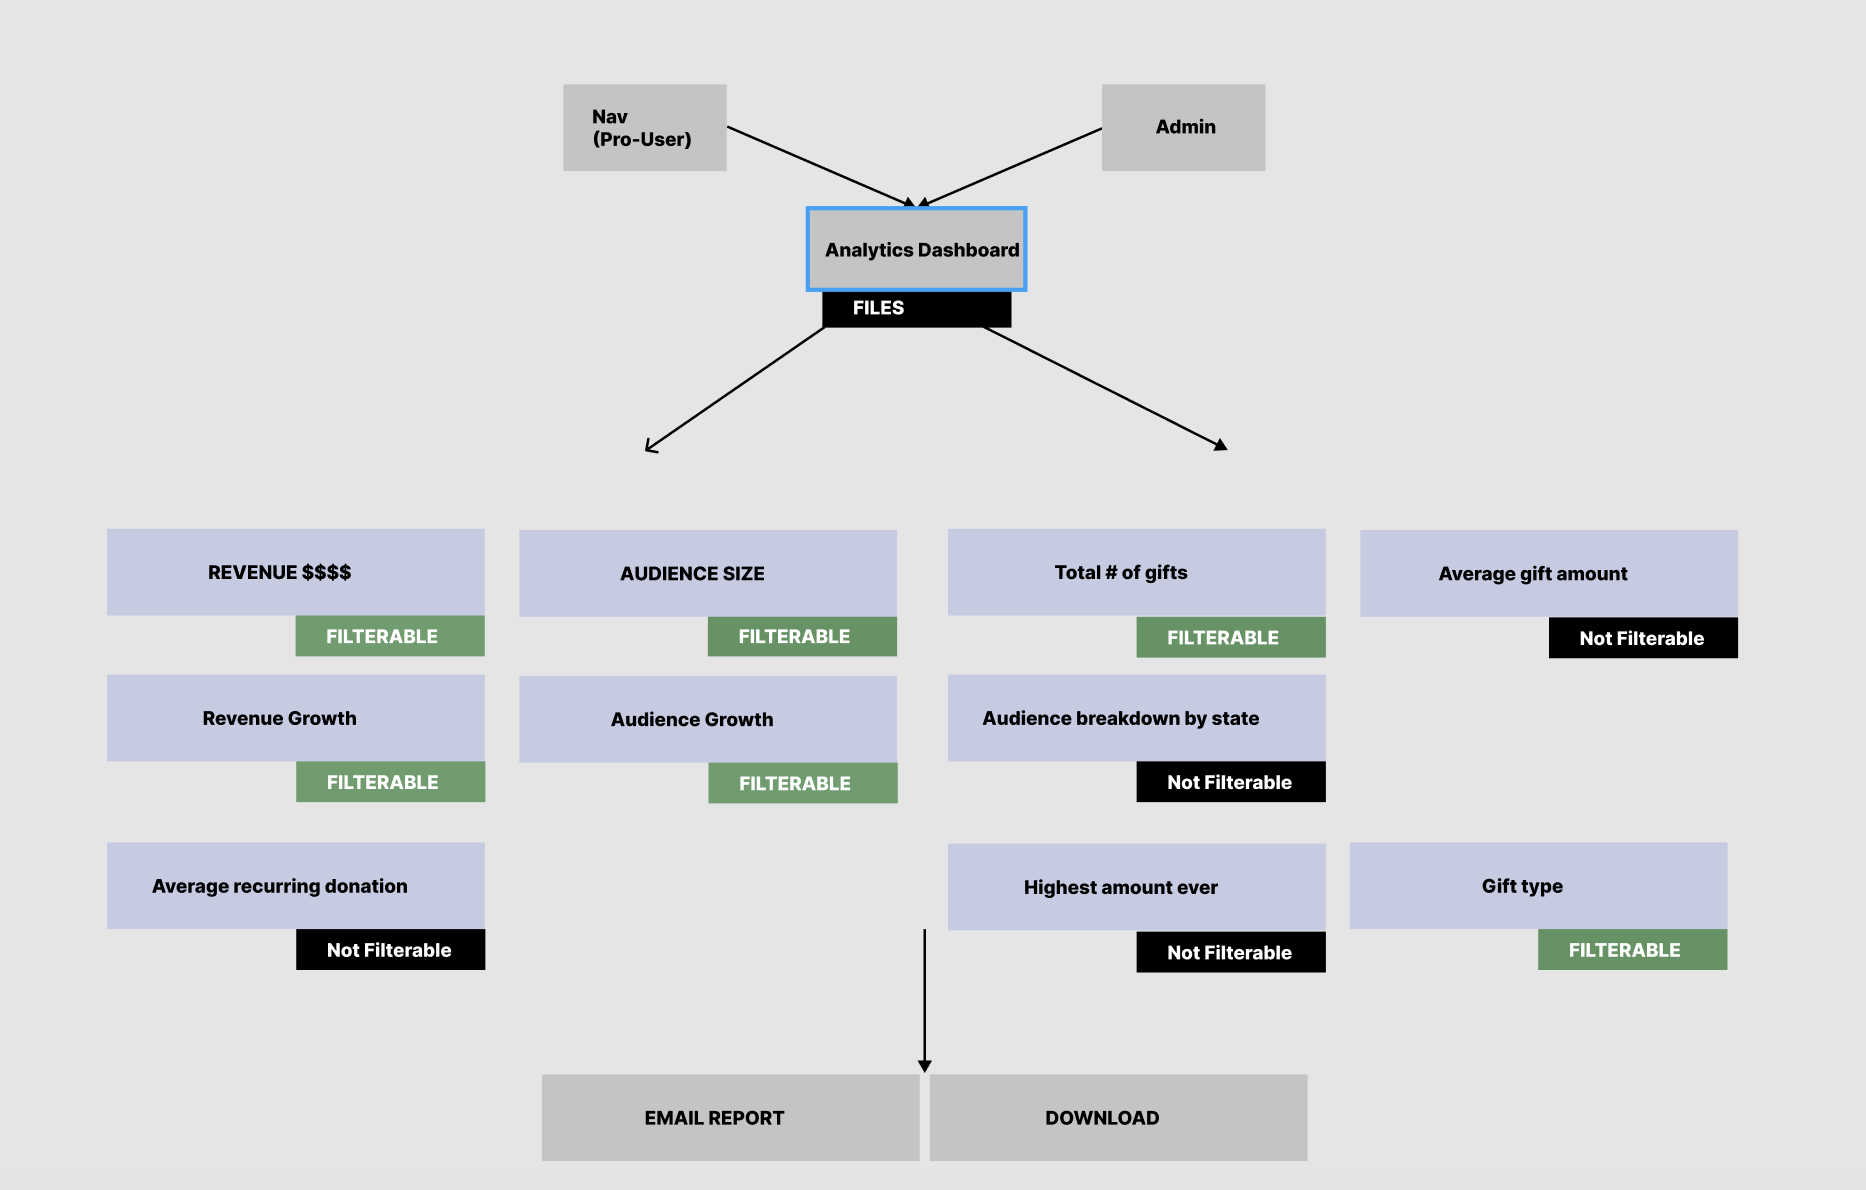
Brief: The client brief requested 10 different types of analytics, 6 of which needed to be filterable by time and 4 that were static.
Hypothesis: Organizations need a way to measure the effectiveness of their fundraising efforts.
Deliverables: Mid-Fi Wireframes, Usability Testing results, and recommendations


Competitive Research
The team began by diving into competitive research of other sites with Analytics features and capabilities. We compiled screenshots from several different platforms in Figma and discussed the various techniques, layouts, which ones we liked and which we disliked.
This research and discussion helps the team to begin the ideation process. From here we began to coordinate the Analytic’s architecture.
Flow
Our client’s brief desired 10 different types of analytics, 6 of which would be filterable by time while the other 4 wouldn’t. Within Figma the team began grouping those analytics by row, the top rows were considered most valuable to the user.
With a rough hierarchy laid out for us, we began to get a better idea of how the Analytics Dashboard would be organized and how we might be able to further group certain analytic pieces such as audience size and audience growth.
We continued with ideation and began sketching our ideas out.


The team presented and discussed each others sketches to pull the best ideas from each to form one collective dashboard.
Wireframing
To try and best utilize our space, while not to overwhelm the user with too much information we opted to combine analytic pieces that were relative into one visual representation. For example, we combined total revenue with revenue growth in the form of either a line or bar graph. We chose to offer both graphs because they provide different values in that with the line graph orgs can see how much they’ve grown as a whole over a period of time, while the bar graph breaks it down to show what days, weeks, or months we were up and which we were down. This enables an org to raise those questions of “why did we only bring in $200 the month of May?”, so as to find a solution faster and become more consistent year round.
More below


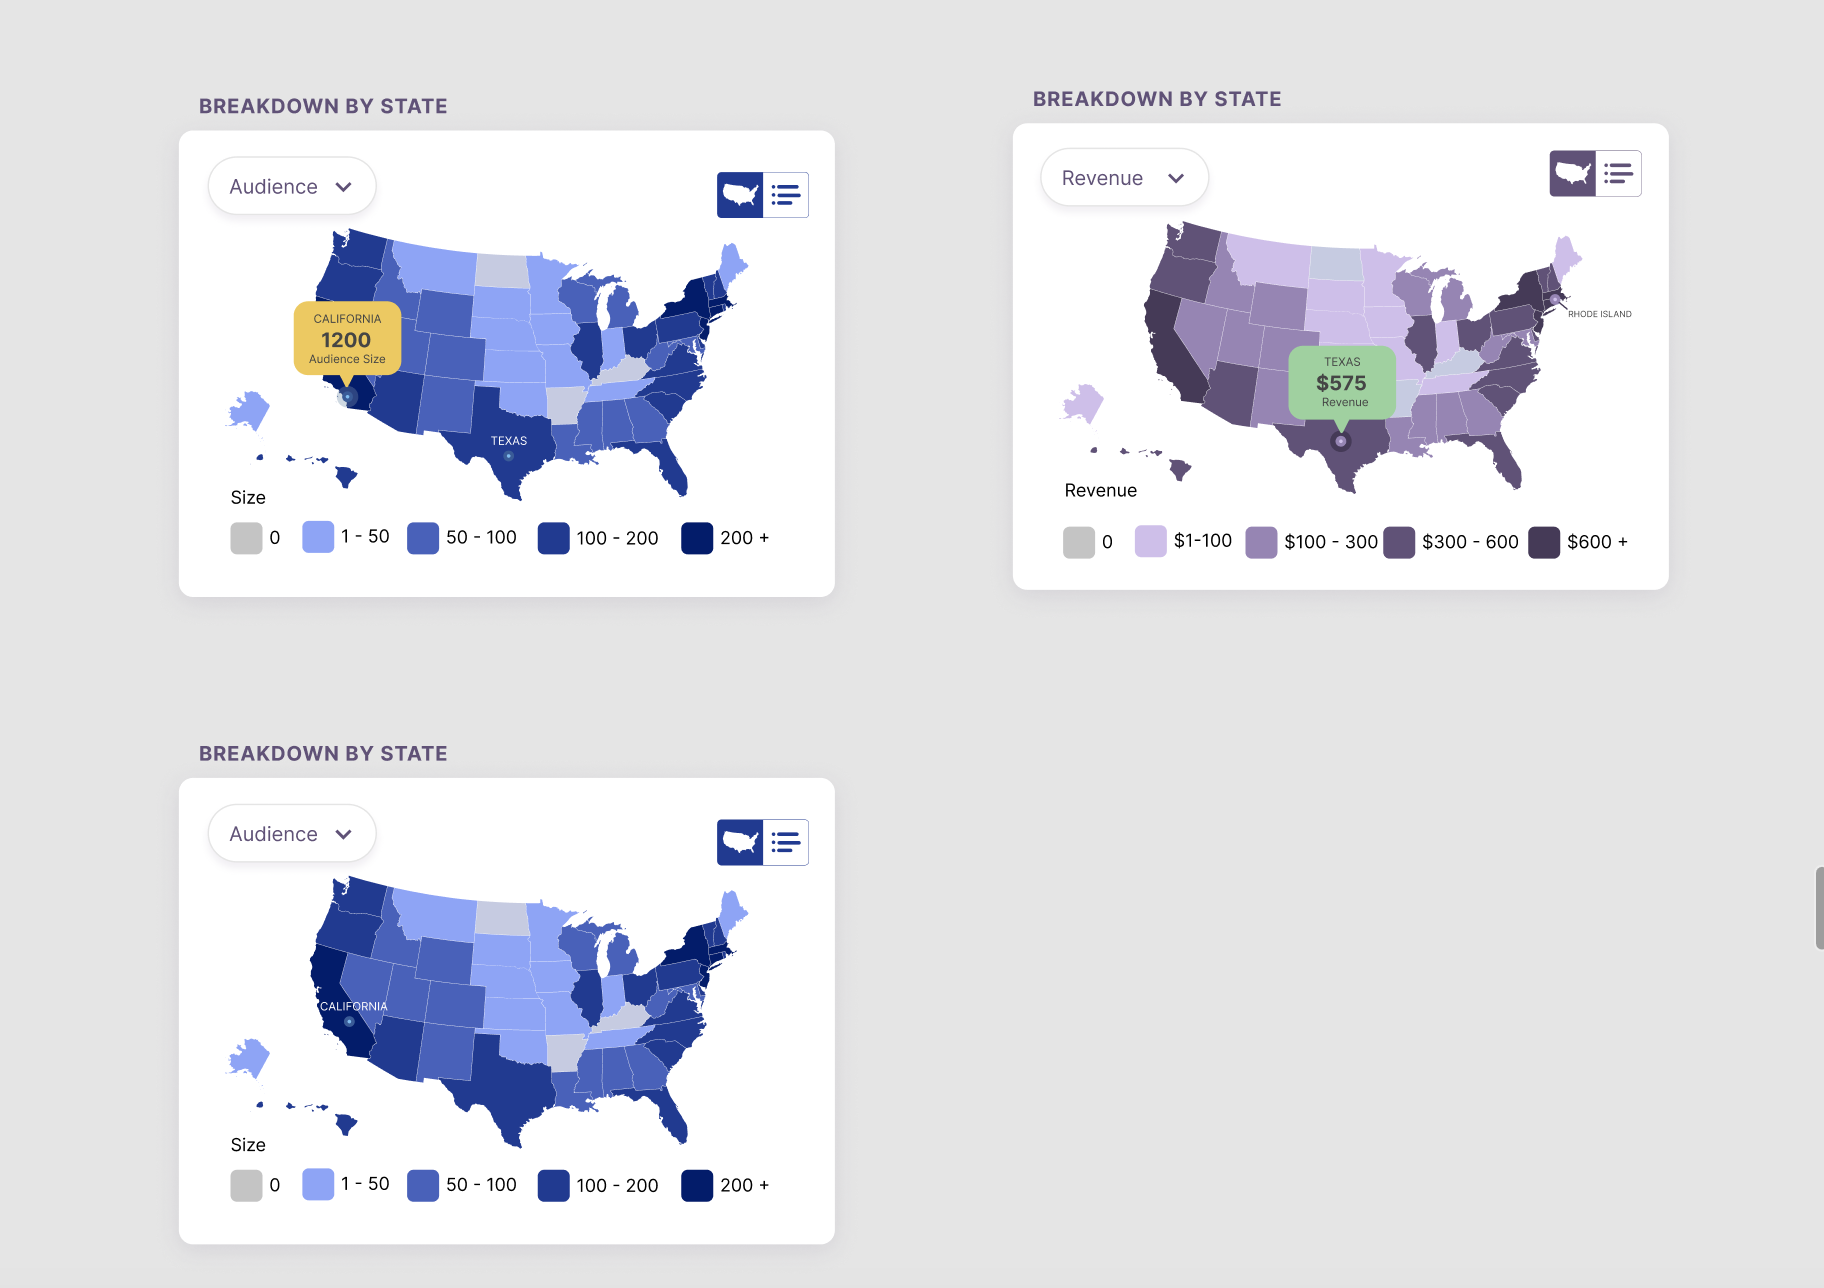
Breakdown by state was an important piece because these orgs want to find ways to better connect with their surrounding communities. That’s why we chose to visually represent this in the form of an interactive map where you can view the country in terms of audience size, or revenue. By analyzing the map, org members will be able to determine what demographic populations they are reaching and which ones they aren’t. They can also view the states in a list format, A - Z, or ranking by audience and revenue size.
Usability Testing
-

Testing Protocol
Before testing we create a protocol to align on our goals, hypotheses, script for interviews, questions, and task/scenarios for our users.
-

Prototype
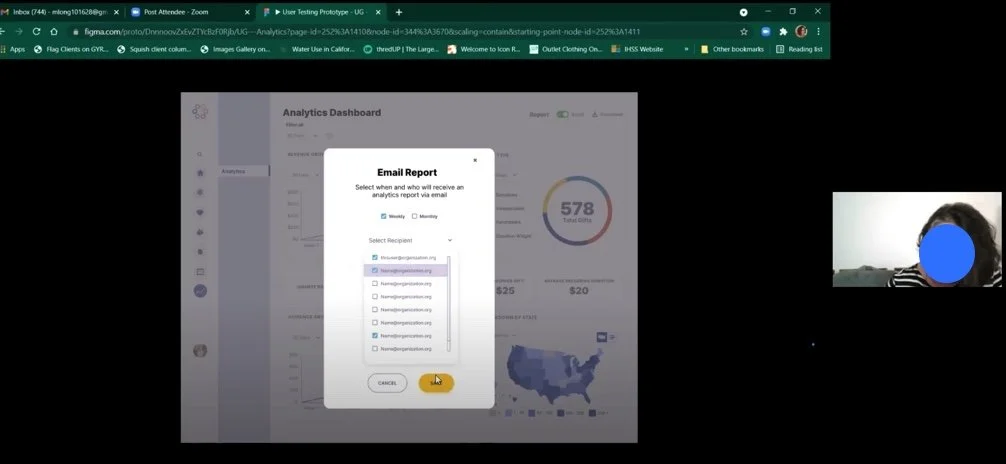
While we begin recruiting people to test, we build out our prototype within Figma. The flow we were looking to test was for the user to view and digest each piece of content on their analytics dashboard.
-
User Test/Interview
In the span of 1 week we tested 4 users. Our process was to ask introductory questions regarding mostly demographics, brief them on what Uncommongood is, then share the prototype link with them and have them share screen. We let each user go through the task prompting them to speak out loud everything they were thinking and feeling during the process. Once the user completed the task, we’d follow up with more questions.
-

Mind Mapping
After testing we take the data we’ve gathered and mind map it. This really means that take each separate piece of data and transcribe them onto stickies which are color coded by user. We take those stickies and organize them by whichever analytic piece they’re relevant to, Audience Growth, Gift Type, States, etc. This helps us see where users where having the most issues or success. Lastly, we highlight above the map 3 things: Good Suggestions, Key Takeaways, and Measurable Data.
Presenting to Stakeholders
We organized all of our data and process in the form of a slideshow to better present and tell a valuable story to the client. We briefly explain the Usability Testing process, then show the pieces that users seemed to like and things that worked successfully. Next we touch on any pieces that might’ve cause the users confusion.
Often times a user will make a remark or a suggestion that the team hadn’t thought about so we bring those up and look to explore any possibilities to make improvements. Lastly, we make calculated recommendations based on not only the feedback from user testing but also our time spent with the feature and expertise in how to iterate to make the most valuable product we can.


